

Turn Factory Data Into Clear Direction
Like a GPS guides you on the road, Navigator guides your teams on the floor — showing where you are, where performance is being lost, and exactly what to do next.


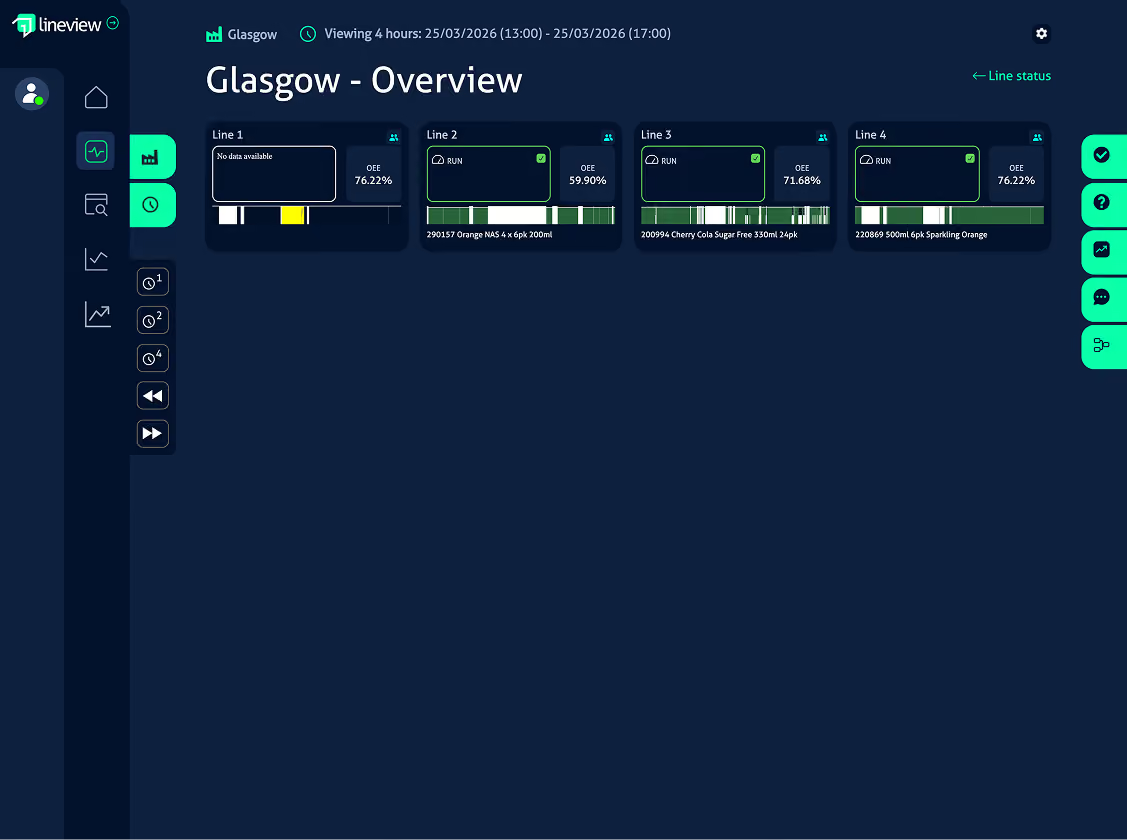


























From the Shop Floor to the Boardroom. One Source of Truth.
Navigator reads directly from PLC code, every stop, every speed deviation, every fault, at sub-second accuracy. That single verified data feed powers every module.

Most OEE tools sit downstream of a historian or rely on operator input. Navigator reads directly from your PLCs. What happens on the line appears on screen immediately. Same numbers on the operator screen as on the group director's dashboard. No reconciliation, no version mismatch.
Five Ways to See Your Lines. One Platform to Run Them.
Click each module to explore what it delivers — from real-time line monitoring to AI-powered decision support.
Monitor
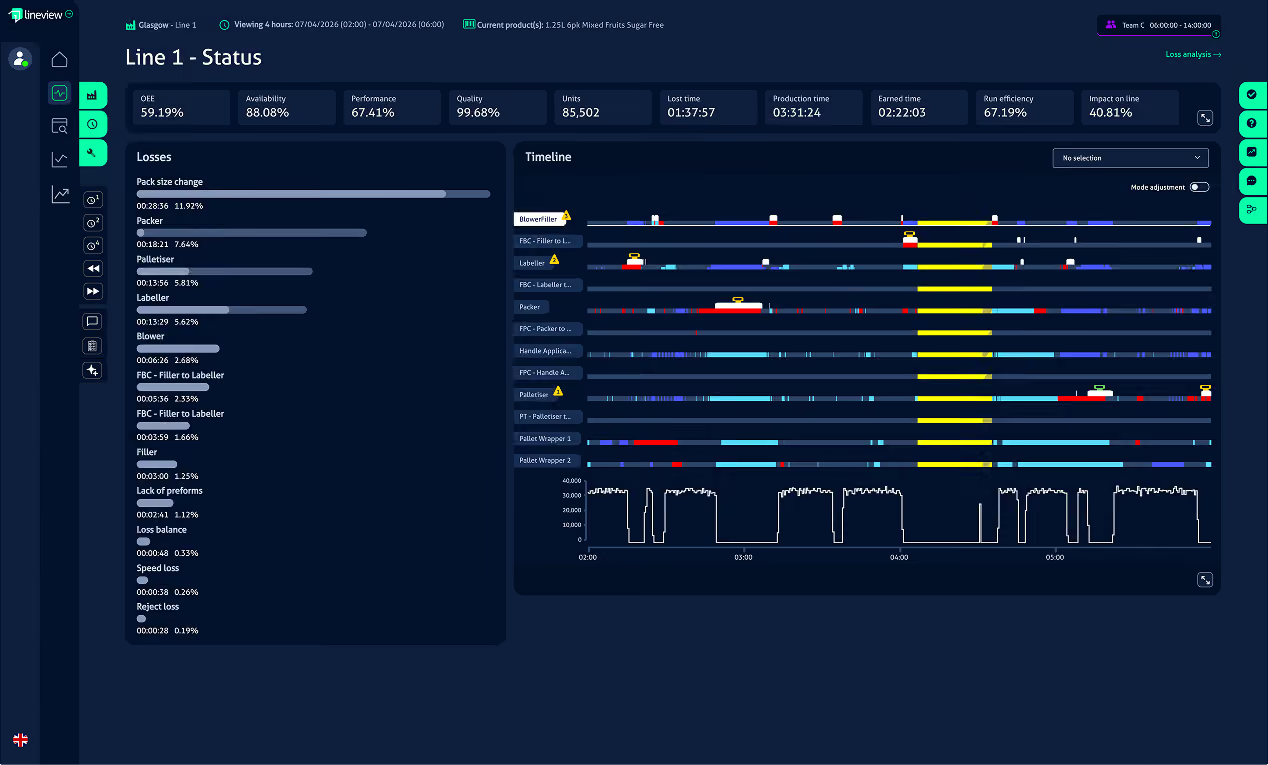
Performance problems on a bottling line are almost always recoverable, if someone acts during the shift. Monitor answers both questions — which problem to act on, and how much output it's costing you — without asking teams to interpret raw data.

Live OEE & Line Status
Every metric, every second. OEE, throughput, line speed, operational mode — updated continuously.

Causal Loss Engine
Separates causal losses from downstream effects. Identifies which event is genuinely constraining throughput.

Exception-Based Prioritisation
Every stop scored by real impact on output. Operators see the three things worth acting on — not a 40-row fault list.
Review
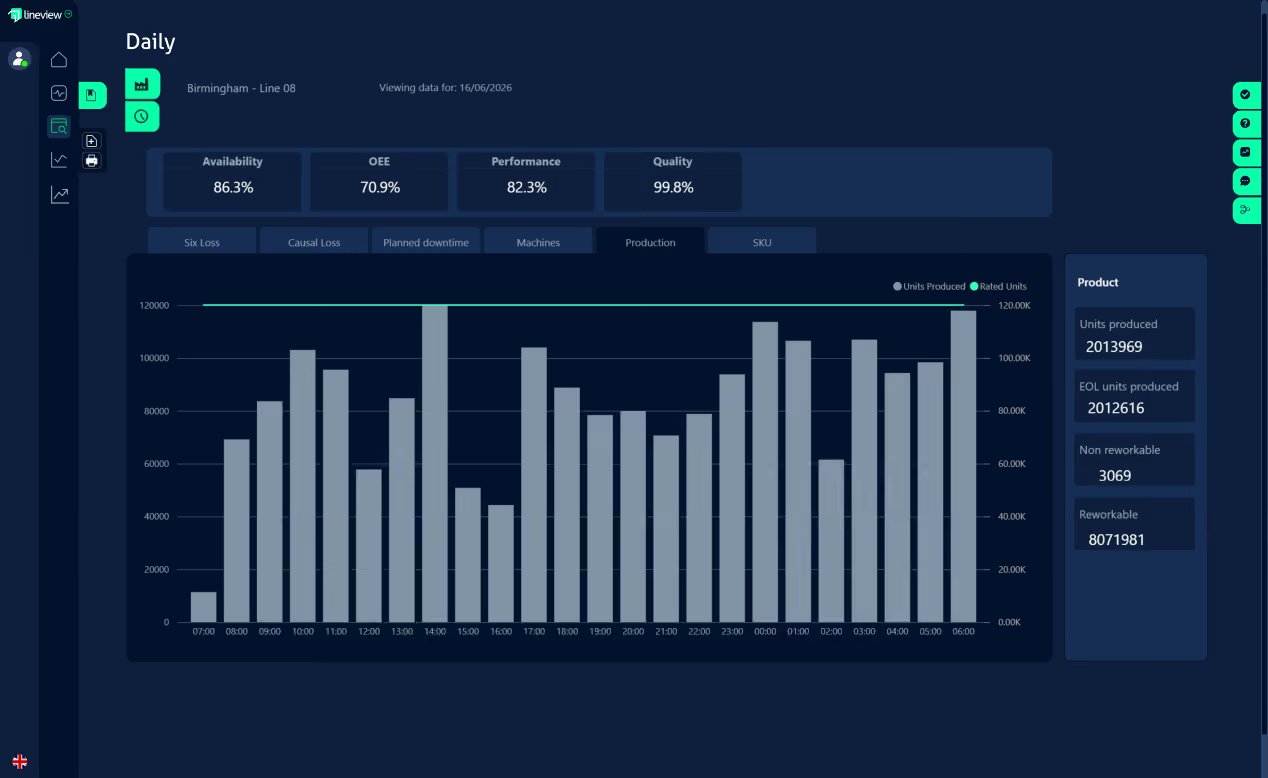
End-of-shift reporting should take minutes. In most plants it takes hours. Review eliminates that entirely — every report is generated automatically from the same PLC data that powered the Monitor screen during the shift.

Shift, Day & Week Reports
Structured performance reports for any period without touching a spreadsheet. The data is already there; Review just organises it.

Exception-Based Summaries
Reports surface only events that deviated from target. Normal activity doesn't clutter the summary.

Cross-Shift Comparison
Compare the same line across different crews. Find where consistency breaks down and where best practice exists.
Analyse
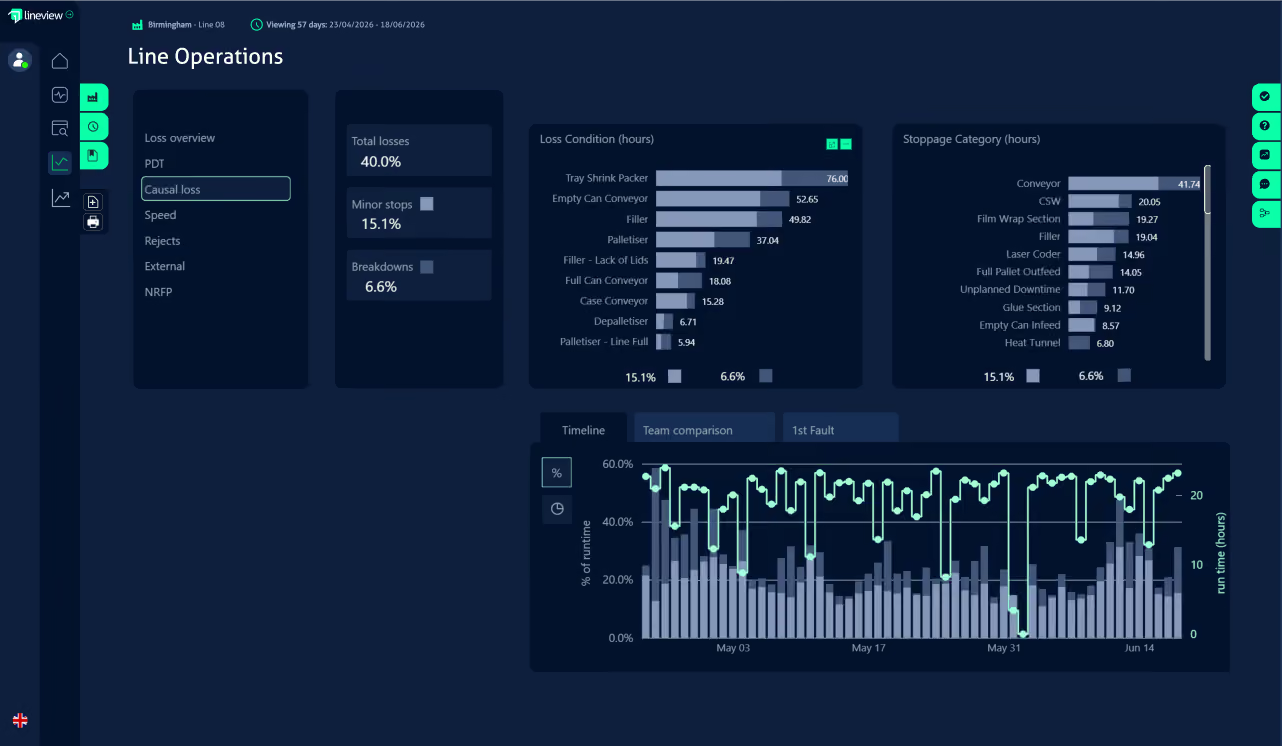
Improving one line is tactical. Improving twenty lines across six countries with different equipment and teams is strategic. Analyse shows not just what is happening, but where the effort will compound.

Cross-Site Benchmarking
Compare performance across lines, sites, and regions using one consistent data framework.

Focused Improvement Deep Dive
Select any causal loss — frequency, duration, shift patterns, trend over 90 days. Evidence base for FI projects built in seconds.

Anonymous Industry Benchmarking
Compare your OEE against anonymised data from similar operations globally. No data leaves your environment.
SmartWorker
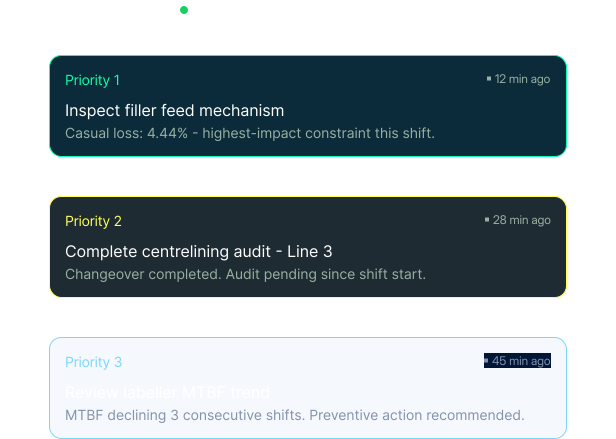
Navigator tells teams where performance is being lost. SmartWorker tells them what to do about it. Built directly on Navigator's live data, it connects real-time intelligence to structured workflows, task management, and team communication.
Next Best Action Engine
Surfaces the top three most relevant tasks every hour, based on real-time loss patterns and machine performance.

Guided Digital Workflows
Step-by-step procedures for shift handover, root cause analysis, centrelining audits, CIL checks, and more.

Chat, Messaging & Alerts
Production conversations anchored to live data. Group channels, direct messages, media attachments, real-time fault alerts.
AMI
Experienced supervisors carry institutional knowledge that takes years to build. AMI makes that knowledge available to every team member, systematically and in real time. Every response is grounded in Navigator's production data.

AI Chat — Instant Production Q&A
Ask any operational question. AMI reads live loss data, event history, and connected documents to give evidence-backed answers.

Automated Intelligence
Proactively detects chronic losses, declining MTBF, data quality issues, and surfaces improvement opportunities.

Specialist AI Agents
Machine Analysis, Site Analysis, and Focused Improvement agents — each delivering deep analytical reports on command.

Same data. Different lens.
Every role gets what they need.
Navigator is designed so every person in your operation sees exactly what they need to act.

Operator
Act on the right thing immediately. No waiting for a supervisor to interpret data.

Shift Supervisor
Redirect effort mid-shift to where it recovers the most output before end of run.

Plant Engineer
Plan maintenance before failures compound. React less; intervene earlier.

Operations Director
See site-wide performance in real time. Find the gap and know exactly where to focus next.
Direct from Your PLCs.No Interpretation Layer Between the Machine and the Screen.
Navigator reads directly from PLC code at sub-second frequency, not from aggregators or operator logs. That single data feed powers everything.
Connect
Navigator reads directly from PLC code at sub-second frequency. Not from a historian. Not from an OPC aggregator. The line data arriving is exactly what the machine produced — no processing lag, no interpretation layer.
Structure
Raw signals are conditioned, standardised, and organised into a consistent data model. Machine names, KPI definitions, loss categories — all configured once and applied consistently across every line and site.
Act
Structured data powers real-time dashboards, automatic reports, strategic analytics, guided workflows, and AI-driven insights. Every module draws from the same single source of truth — from operator screen to boardroom.

Trusted by operations teams running the world's biggest lines.
From single sites to global networks, here's what happens when beverage plants stop guessing and start acting on the right data.

“The tool makes it much easier to understand what’s happening on the production line in real time. It’s very user-friendly, so both operators and leadership can quickly see performance and identify issues. It’s been a solid support in driving awareness and improvements across the line.”

“Before Lineview, we could not capture short stoppages. Now every stoppage is recorded automatically, giving us reliable data for analysis and decisions.”

“It is not just the tool but the support around it that makes the difference.”

“This has helped us realise that we can improve beyond what was done decades ago. It has opened our eyes to areas that were in front of us the whole time, we just could not see them.”

“We wanted more than a vendor; we needed a strategic partner. Lineview had the enabling technology and deep operational expertise to support our transformation. Their team guided us through critical change management and helped us embrace new concepts to truly transform our business.”

“Applying Lineview to our lines, along with the support of the customer success team, has highlighted exactly where to pinpoint our efforts. We’ve really got to the heart of long-standing concerns and were able to mobilise the business with clear, unambiguous information.”
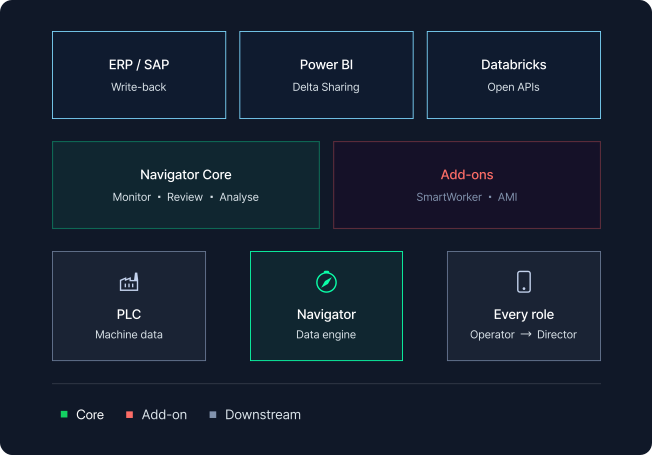
Built to Fit Your Existing Stack, Not Replace It.
Navigator connects to your existing PLCs, historians, MES, and ERP systems, with data flowing seamlessly into your BI tools, data lake, and reporting platforms.

