Monitor
Like a GPS guides you on the road, Navigator guides your teams on the floor — showing where you are, where performance is being lost, and exactly what to do next.
Performance problems on a bottling line are almost always recoverable, if someone acts during the shift. The challenge is knowing which problem to act on, and how much output it's actually costing you. Monitor answers both, without asking teams to interpret raw data.



































Key Features

Live OEE & Line Status
OEE, throughput, line speed, and operational mode, updated continuously, no refresh required. Teams see what's happening now, not what happened an hour ago.

Causal Loss Engine
Navigator separates causal losses from downstream effects. It identifies which event is genuinely constraining throughput, not which machine faulted most. That distinction matters when you have 20 minutes left in a shift.

Exception-Based Prioritisation
Every stop and deviation is scored by its real impact on output. Operators see the three things worth acting on; not a 40-row fault list ordered by timestamp.

Causal Loss Priority Indicator
A visual indicator on the status screen flags the highest-impact constraint in real time. No menu navigation. No searching. One look, clear direction.

KPI RAG Status
Set OEE thresholds for each line. KPIs change colour automatically when performance crosses a boundary, green running well, amber drifting, red needs attention now.

First-Hour Instability Capture
Line instability in the first hour of a shift is one of the highest sources of hidden losses. Monitor captures every micro-stoppage and speed deviation from PLC startup, not from when an operator first logs in.
Line Dashboard
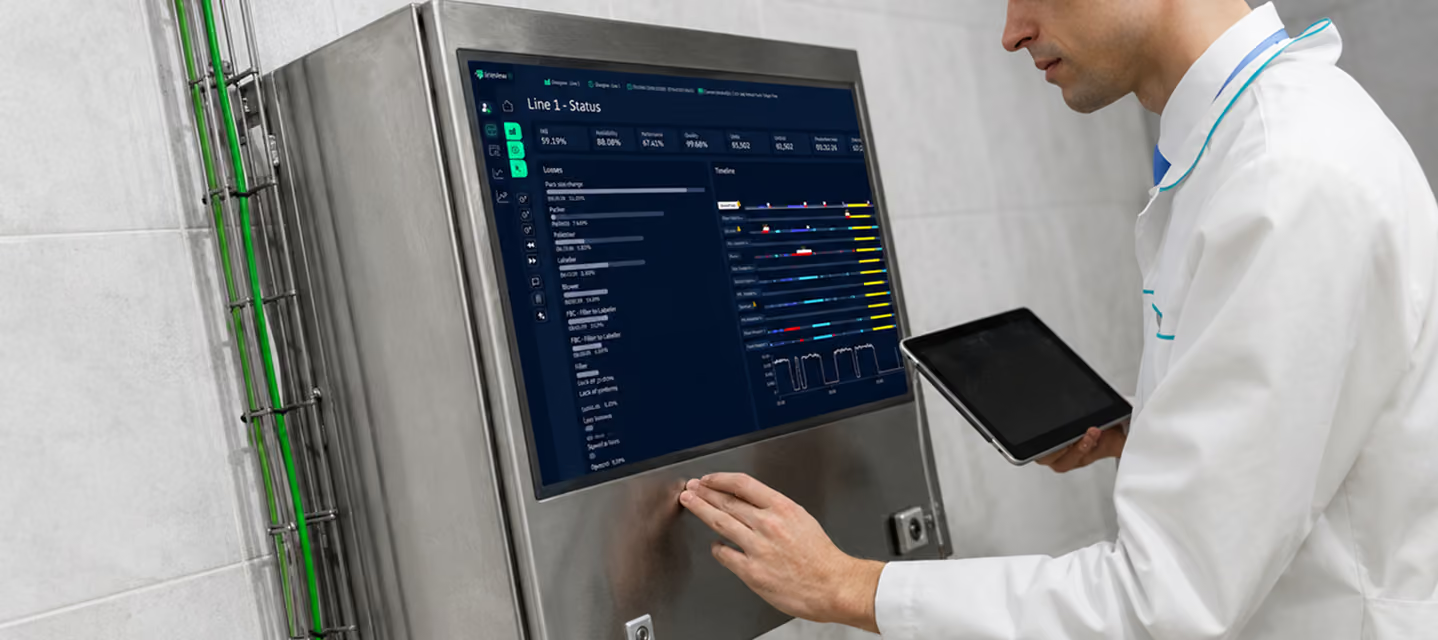
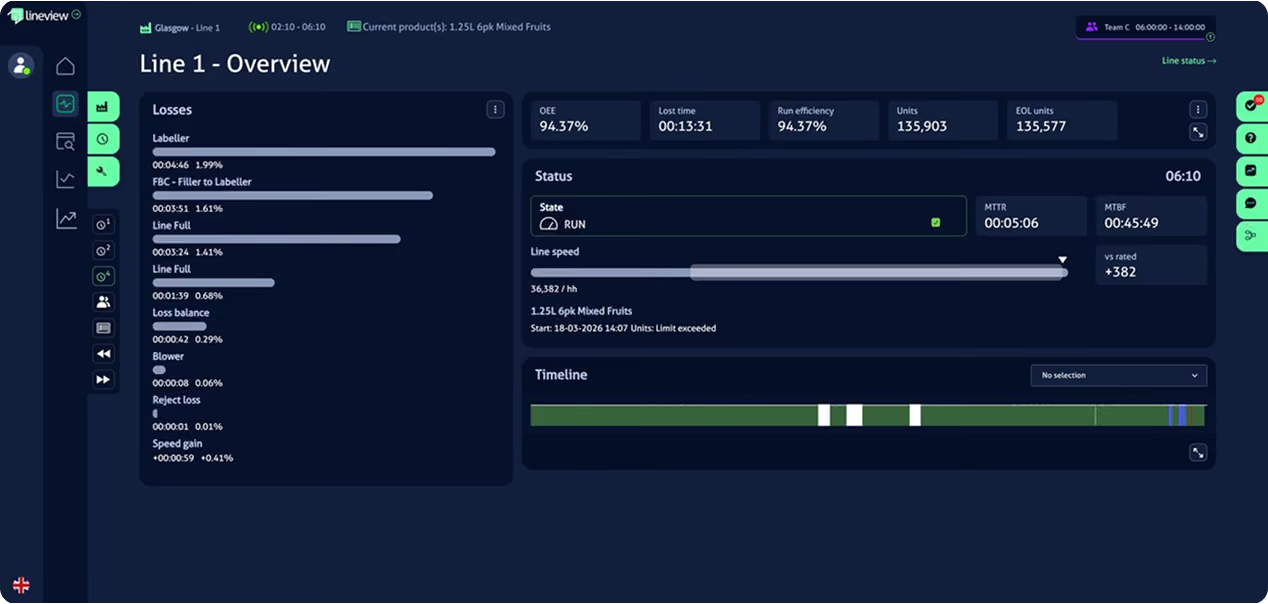
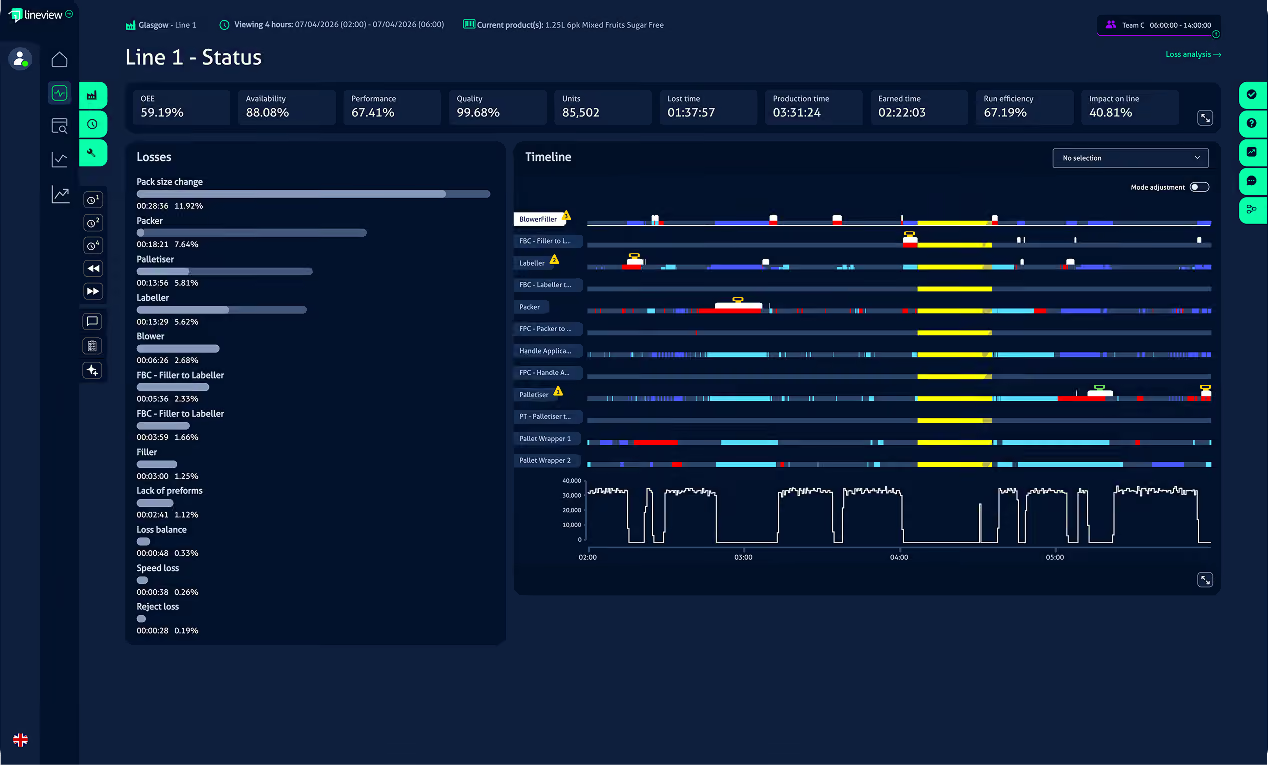
See every machine on the line in real time. The production timeline shows stoppages, mode changes, and production runs — giving operators and supervisors instant context on what’s happening and why.
Line Status
OEE, availability, performance, and quality — updated live across the shift. The losses panel ranks every stoppage by impact, while the production timeline maps each machine’s state minute by minute. Supervisors see exactly where the shift stands without switching between reports.
Loss Analysis
Interactive Pareto charts and loss breakdowns by category, machine, and time period. See the real cost of each stoppage type and identify the losses worth targeting first.
Machine Status Detail
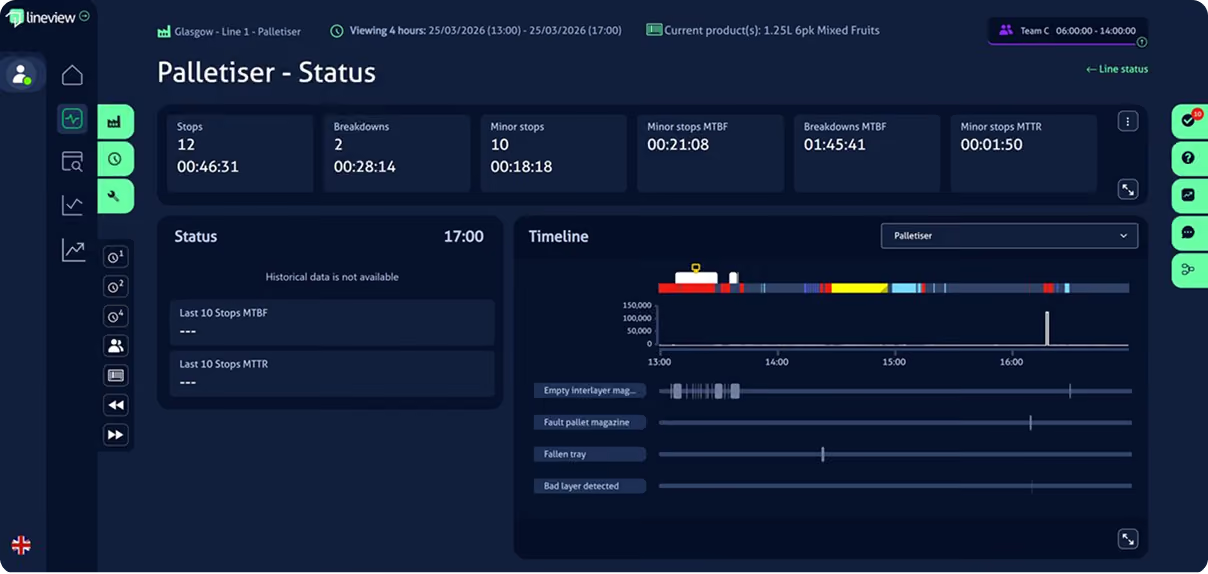
Click any machine to see its current state, recent faults, stoppage durations, and performance against target. Built for operators who need to act fast and engineers who need to understand root cause.
Advanced Capabilities
Minor Stop Detection
Micro-stoppages under 30 seconds rarely appear in manual logs. Navigator captures every one directly from PLC signals, then ranks their cumulative impact. On most lines, this is where the biggest recoverable capacity sits.

IFA Timeline in Monitor
The IFA Timeline visualises how well teams are executing the three fundamentals of shift management: capturing information, focusing on the right constraints, and taking action. Updated shift-by-shift, visible to every supervisor.

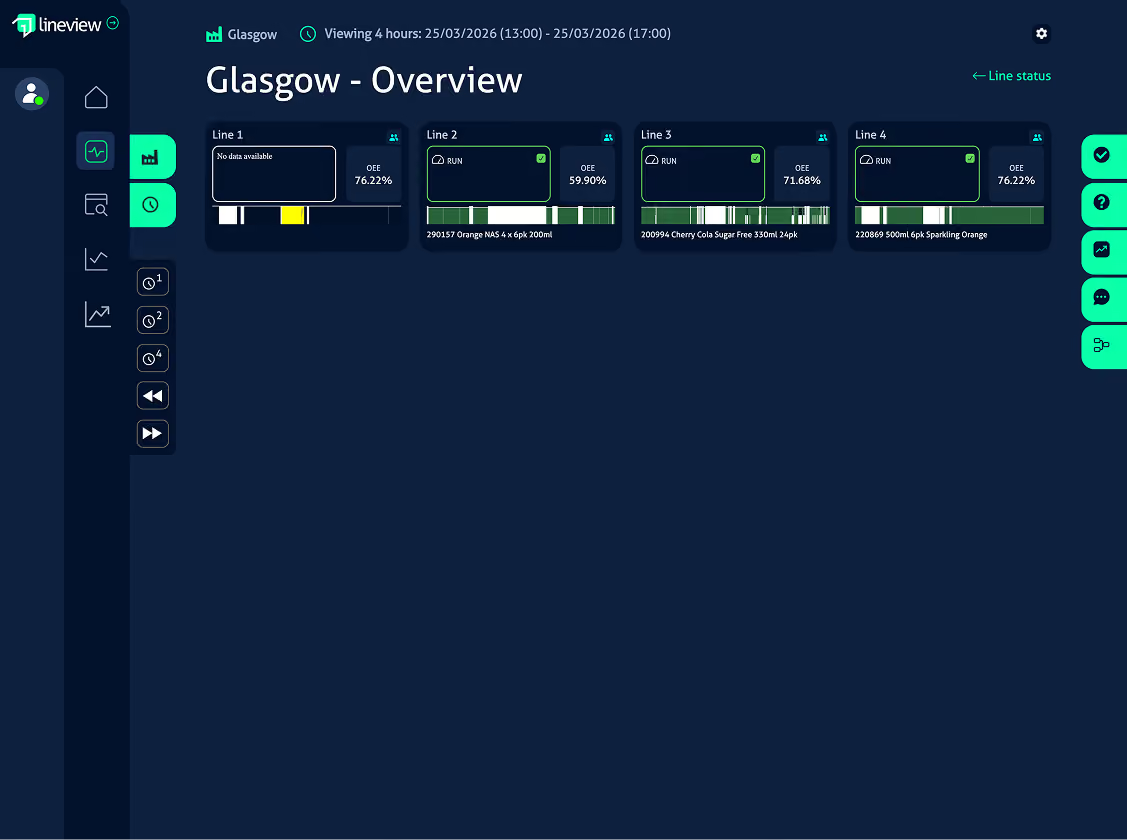
Factory Status Dashboard
A live snapshot across every line: active shifts, current OEE, line status, and any escalated issues. Plant managers can see what's wrong before the phone rings.

Role-Based Dashboards
Operators see their line. Supervisors see their section. Plant managers see the site. Group directors see across facilities. Each view is configured to the decisions that role needs to make, not a one-size list of metrics.

Andon / TV Display
Stream live OEE, targets-versus-actuals, and active losses to large-format screens. Crew members see how the shift is running without leaving their station.
API-Driven Line Configuration
External systems can trigger mode changes, SKU switches, and line configuration updates via API, keeping Navigator aligned with your production schedule without manual input.
Who Uses Monitor and How?

Act on the right thing immediately. No waiting for a supervisor to interpret data.
What they see: Live OEE, speed vs. target, loss list ranked by impact.


Redirect effort mid-shift to where it recovers the most output before the end of run.
What they see: Causal loss ranking, IFA Timeline score, exception alerts.


Plan maintenance before failures compound. React less; intervene earlier.
What they see: Equipment fault patterns, causal loss frequency, MTBF data.


See site-wide performance in real time. Catch issues before they affect the full shift.
What they see: Factory status dashboard across all lines.