

Review
Tactical shift reporting. Structured, automatic, and ready before the next crew starts.
End-of-shift reporting should take minutes. In most plants it takes hours, manual data extraction, spreadsheet reconciliation, debating which numbers are right. Review eliminates that entirely. Every report is generated automatically from the same PLC data that powered the Monitor screen during the shift.






































Key Features

Shift, Day & Week Reports
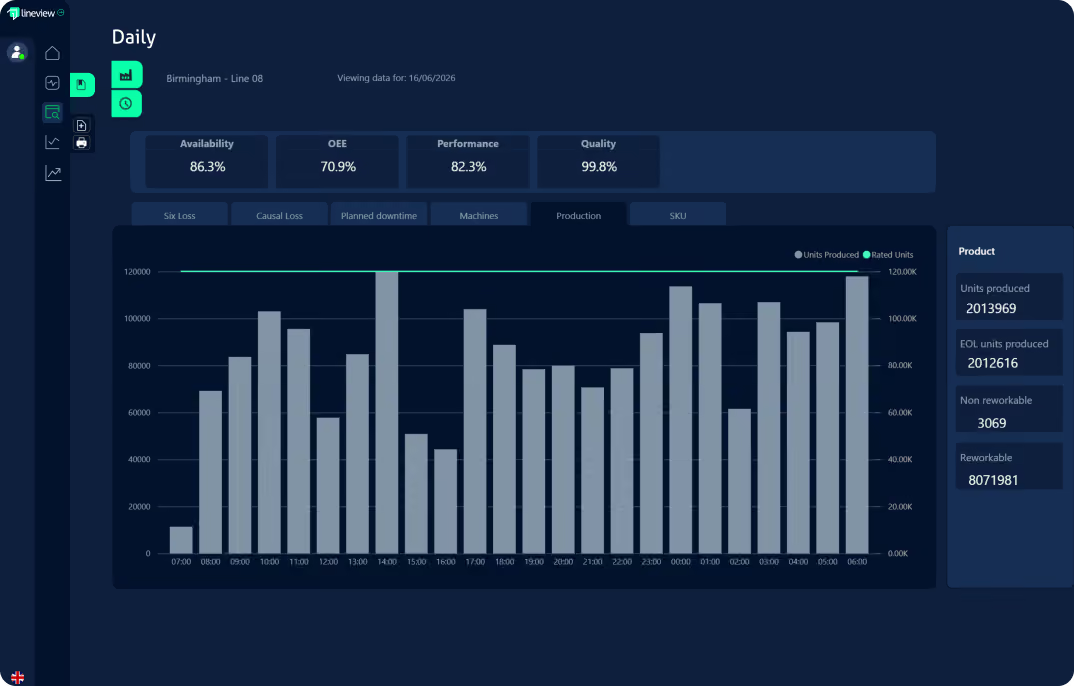
Generate structured performance reports for any period, a single shift, a full day, or a month, without touching a spreadsheet. The data is already there; Review just organises it.

Performance Narratives
Review doesn't output a data dump. It produces a shift narrative: what ran, what stopped, what cost the most cases, and how this shift compared to target. Team leaders can walk into a review meeting in 60 seconds.

Exception-Based Summaries
Reports surface events that matter: deviations from planned OEE, losses above threshold, changeovers that ran long. Normal activity doesn't clutter the summary.

Cross-Shift Comparison
Compare the same line across different crews. When one shift consistently outperforms another by 6 OEE points, Review makes that visible and quantifiable, giving CI leaders somewhere specific to investigate.

Trial Run Isolation
Flag trial runs and new SKU introductions so they're excluded from standard performance reporting. Your OEE baseline stays accurate even during testing periods.

SIC Data in Reports
Short Interval Control data is included in shift reports, linking what teams did during the shift to the performance outcomes they achieved. It closes the gap between action and accountability.
Daily Losses Breakdown
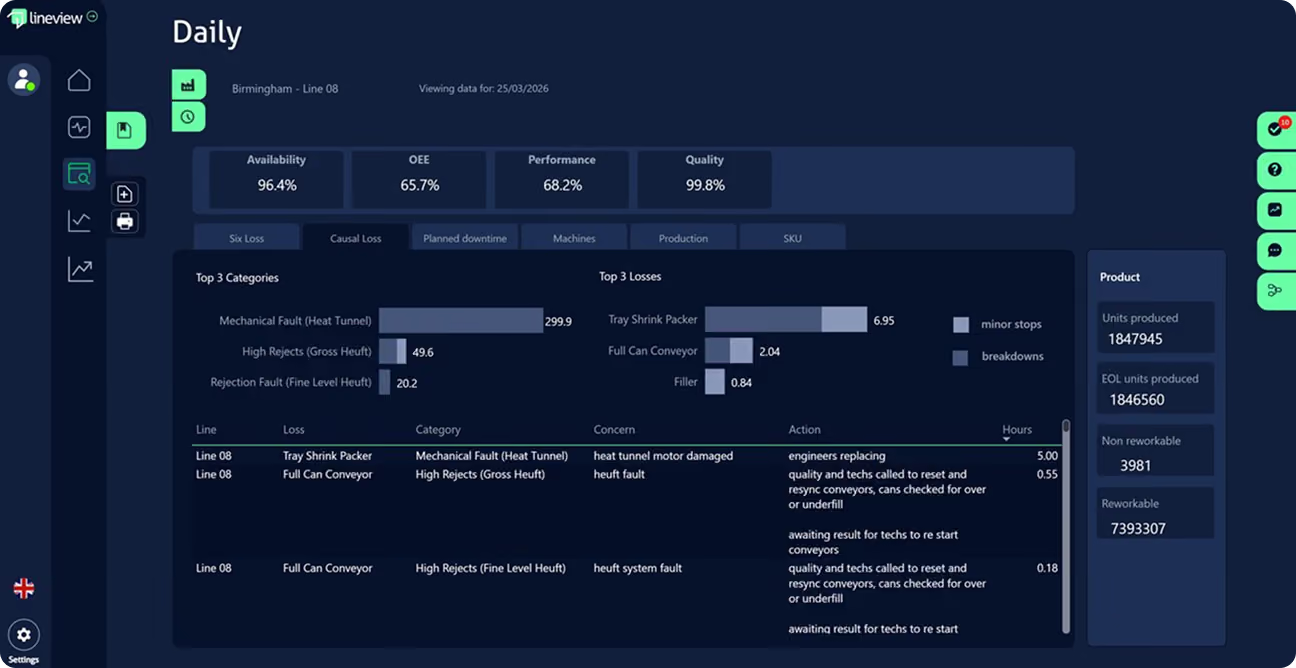
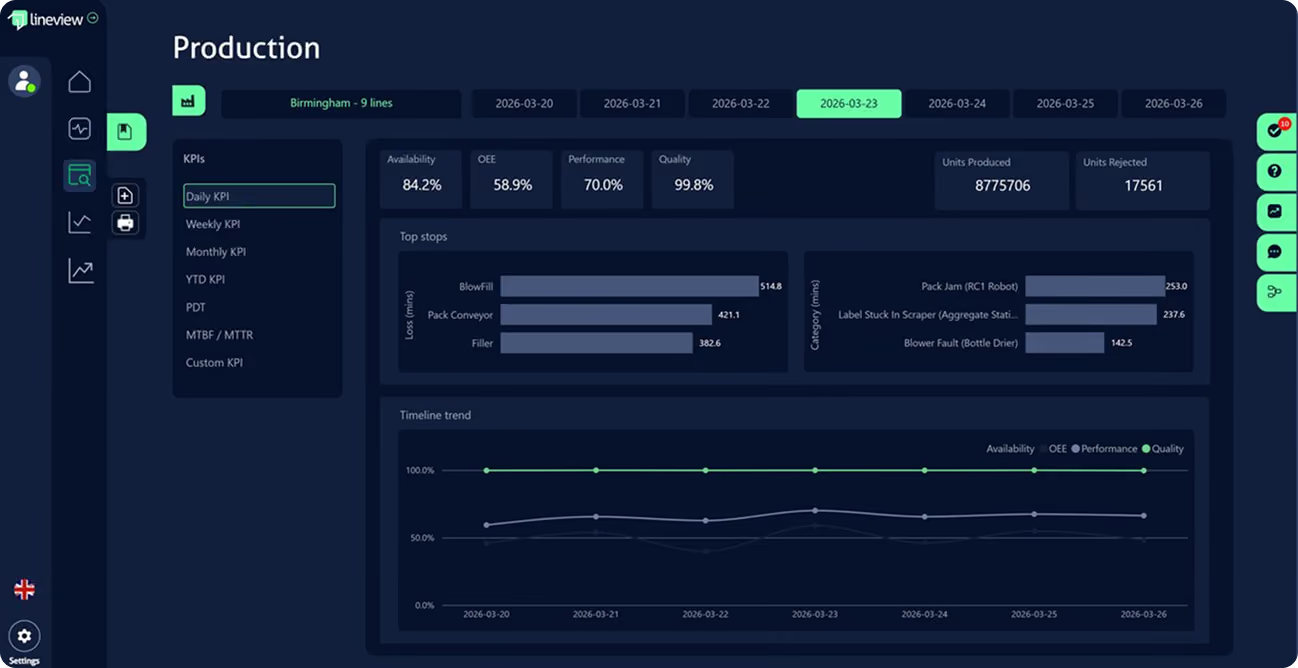
Shift reports break down every minute of lost time by category. Teams see exactly where performance was lost — not just that it was lost — with causal context that connects stoppages to their real drivers.
Production Report
Track every production order through the line with full traceability. See actual vs planned performance, reject rates, and speed profiles — giving production managers the data they need for continuous improvement.
PDT Analysis
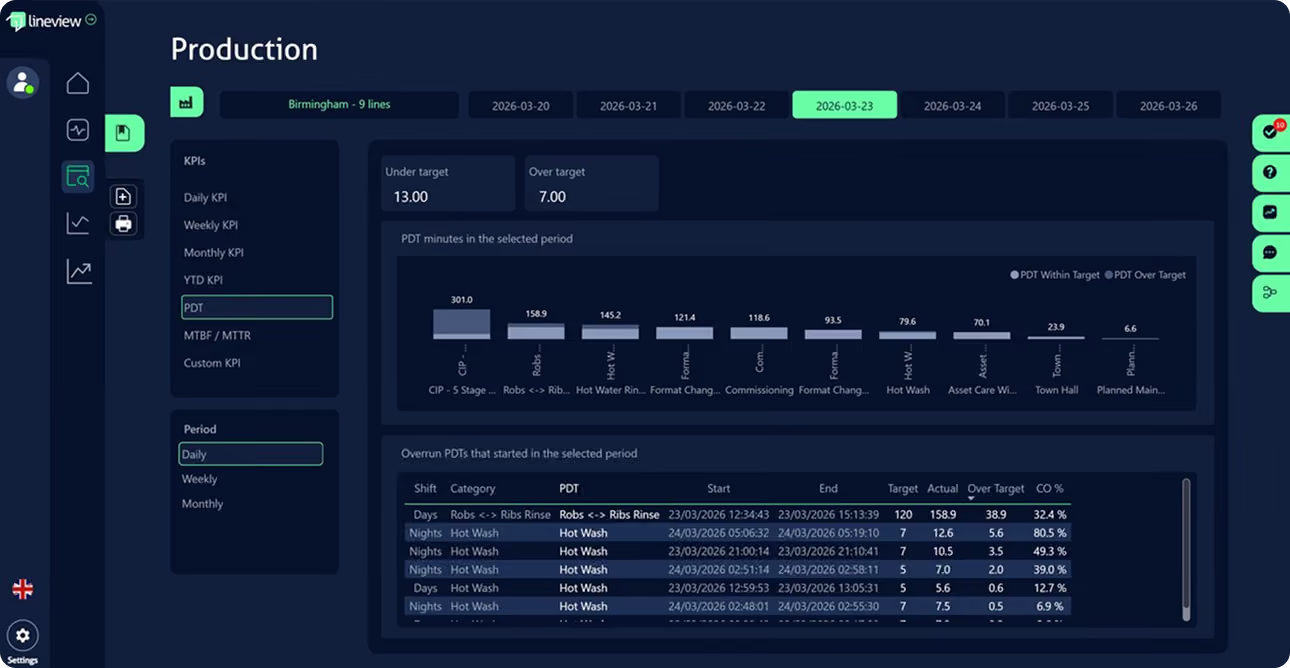
Changeovers, CIP, and planned maintenance analysed in detail. Understand actual durations vs targets, identify the changeovers that consistently overrun, and build the case for improvement.
Data Integrity & Access

Data Integrity Dashboard
Review flags data quality issues, missing signals, incomplete periods, suspect events, so teams know when to rely on the data and when to investigate the source before drawing conclusions.

Anytime, Anywhere Access
All reports are available from any device, any time. The operations manager reviewing overnight performance from home sees the same numbers as the shift leader on site.
